Sisense Forge

Overview
Sisense sells embedded analytics - the dashboards and data experiences other companies put inside their own products. That business ran sales-led: long enterprise cycles, solution architects, a platform built around BI teams.
“Forge” was a bet on a different motion - a separate product line for developer teams, adopted self-serve, and Sisense’s first attempt at product-led growth. It paired with Compose SDK, Sisense’s embedding SDK: Forge was the console where you connect a source, model it, and compose queries, and its output was code you paste into your own application.
Status: shut down before launch - a business call about time and resources, taken when the design was largely complete and validated with design partners. “Forge” was an internal codename; the product never got a public one.
Audience
Development teams inside customer product organizations - not BI analysts. In practice, several roles at once:
- Frontend or full-stack engineers embedding visualizations into a product UI
- Data engineers, where a team has them, connecting and preparing sources
- Product teams defining product logic and preparing sample assets
The finding that shaped the product most concerned environment rather than functionality: the main persona lives in an IDE and judges any unfamiliar tool against that reference - which set the terms for everything below.
Challenge
Self-serve adoption puts the whole burden on the first session. We designed against three measures - time to connected data, time to first query, time to first chart - targeting value within five minutes, legible without anyone narrating it.
The structural difficulty: embedded analytics has an irreducible middle step. Before anyone can query, someone has to model the data. A sales-led motion absorbs that through solution architects; a self-serve motion drops it on a team that may have no data specialist at all.
My Role
As Director of Product Design I owned the design side of the line and sat on the steering committee running it, contributing to the PLG strategy alongside product and engineering leadership. A significant share of the work I did hands-on:
- the design system - color, layout language, visual direction
- the information architecture - navigation, page nesting, the elements the product is built from, and how flows are staged
- several areas and components designed end to end
Collaborators
- Product directors and the PMs owning each area
- Engineering directors and their teams
- Community, outbound, and product marketing - DevRel and growth
Constraints
- A mature platform. The Sisense codebase needed substantial modernization in its own right.
- No self-serve infrastructure. A parallel move to SaaS infrastructure was underway to create it.
- Fixed timeline, limited resources.
Design Process
Three stages:
- Research and positioning - mapping how analytics actually gets built, understanding what is specific to the main persona, then redefining that knowledge around the PLG motion
- Design system and happy path, developed in parallel
- Depth by area - Connections, Modeling, Query
1a
Research: how analytics actually gets built
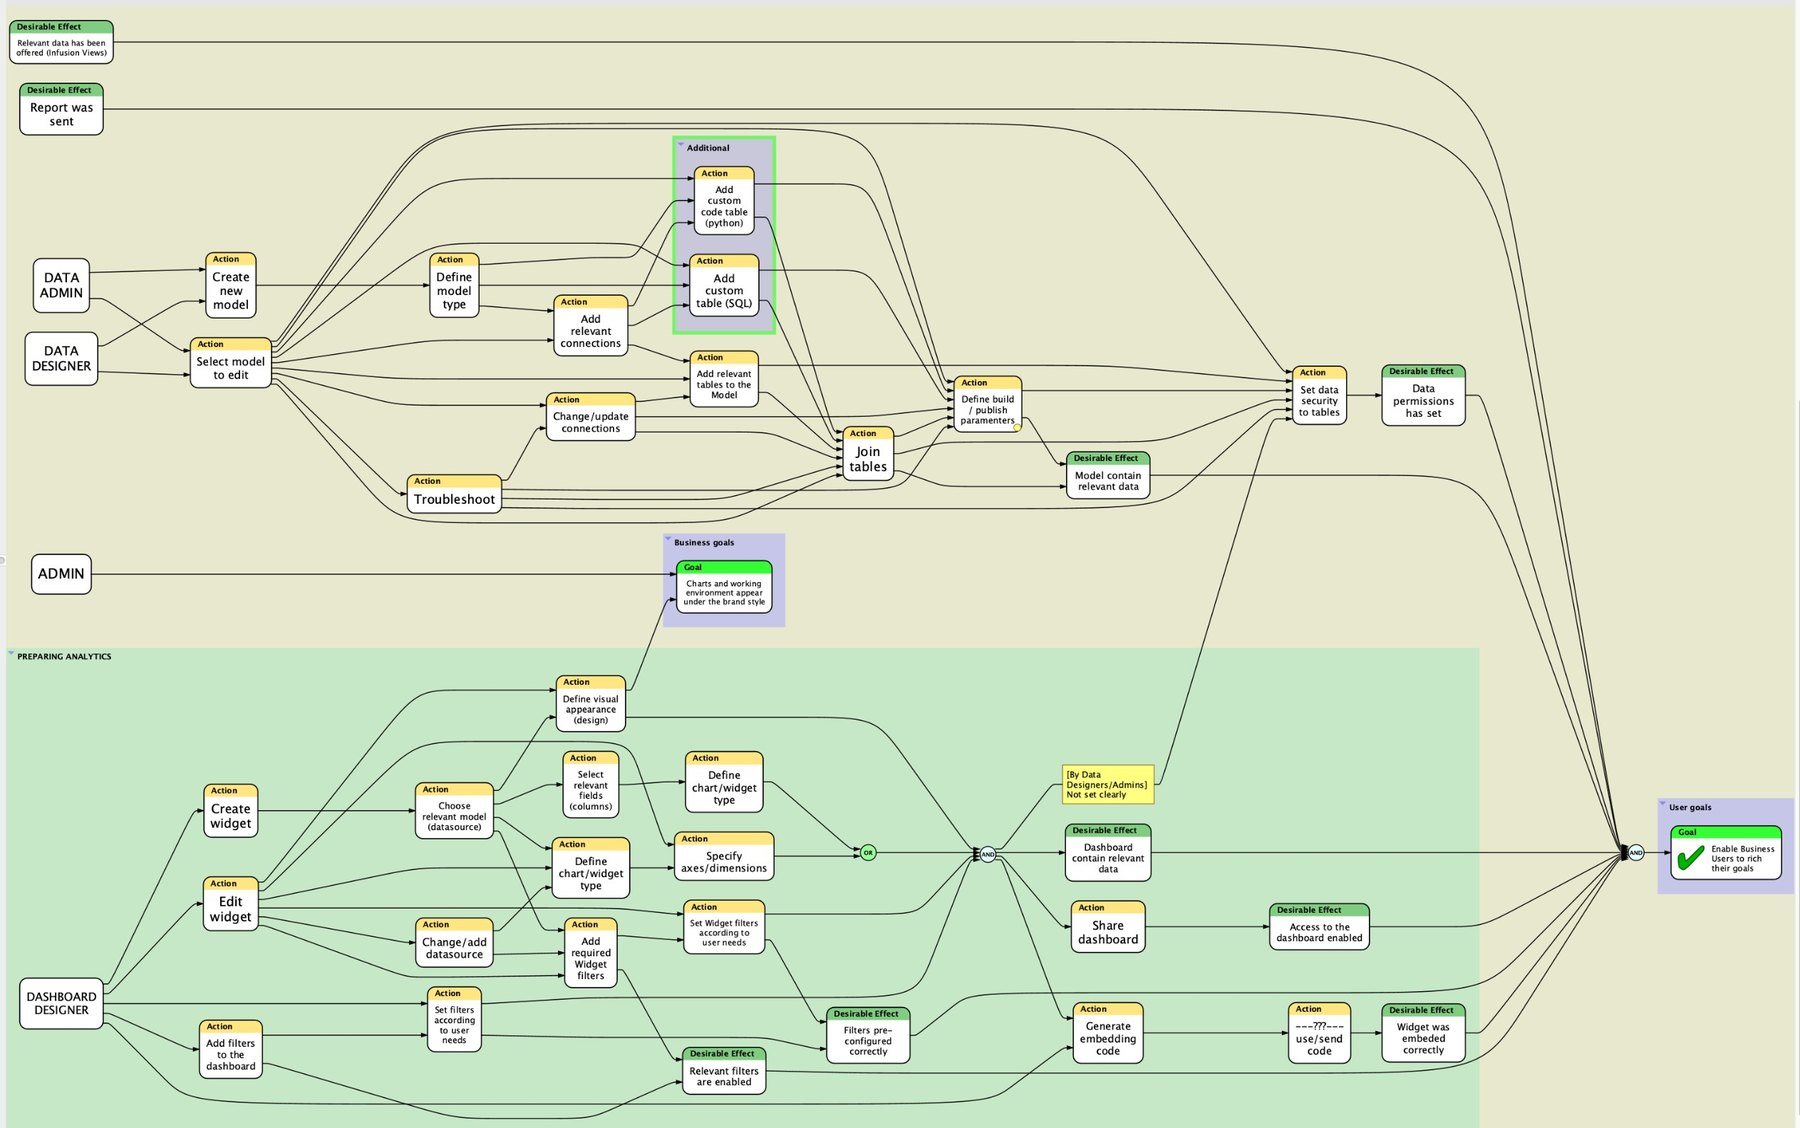
We started by mapping the existing product against observed user behavior - every role, action, and the effect each action was supposed to produce.
Two findings shaped everything after. Analytics work was distributed across four distinct roles, with long chains of actions separating an intent from its result. And the embedding step - the one a developer cares about most - was the least defined part of the map.
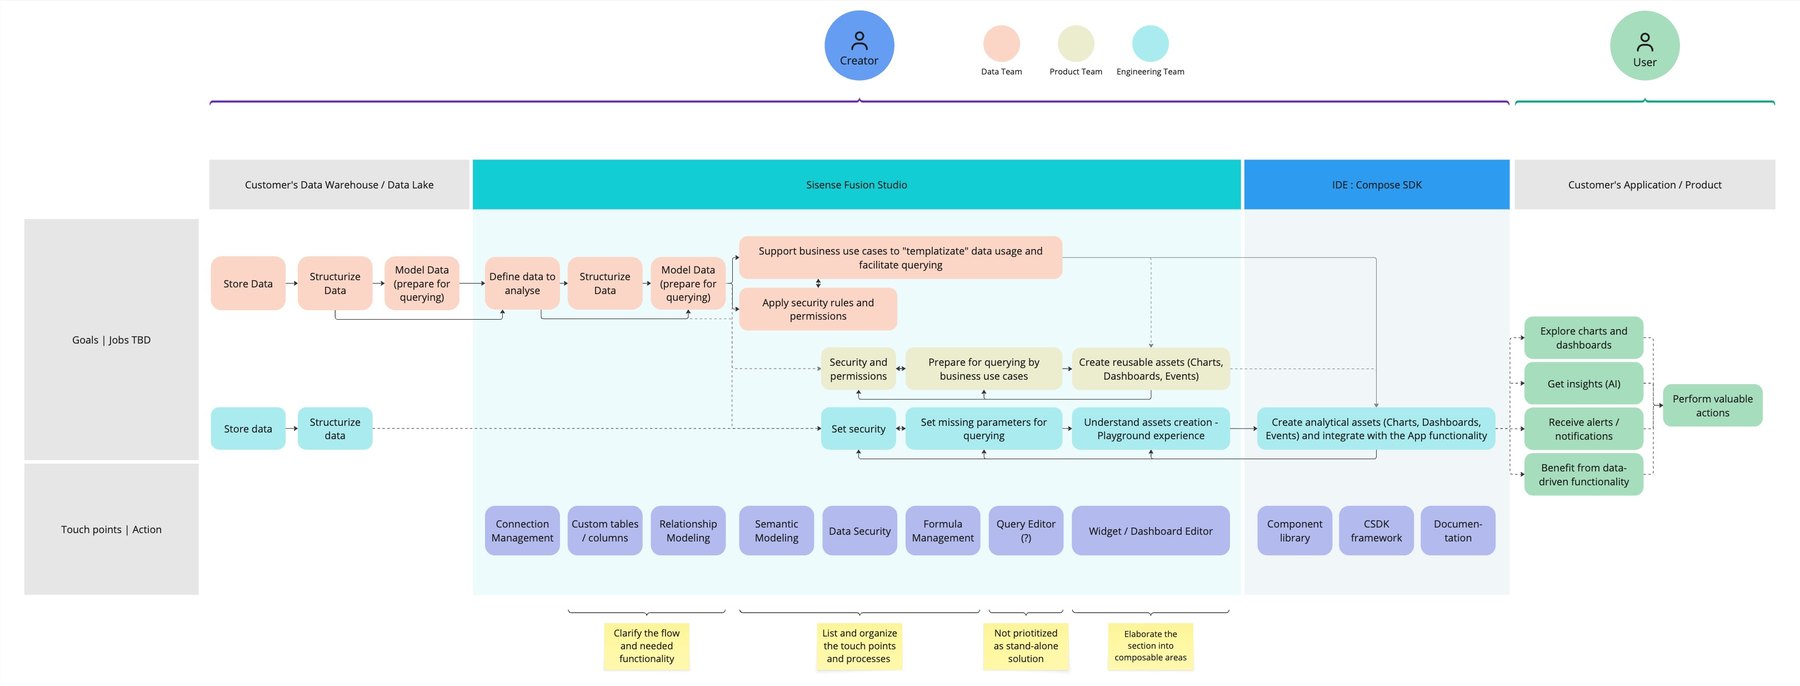
We then redrew the process around the teams that do the work rather than the roles the platform assumed: what happens in the customer’s warehouse, what happens in Sisense, what happens in the IDE, and what reaches the end user. The touchpoints listed under each stage became the functional scope of the product line.
1b
Designing the PLG motion
Self-serve adoption is a sequence of questions, and each one has to be answered by a surface the company actually owns. We modeled the developer’s path as five stages, defined by the question being asked at each: is this of use to me, will it meet my needs, how does it work, can I build a proof of concept, can I build for scale.
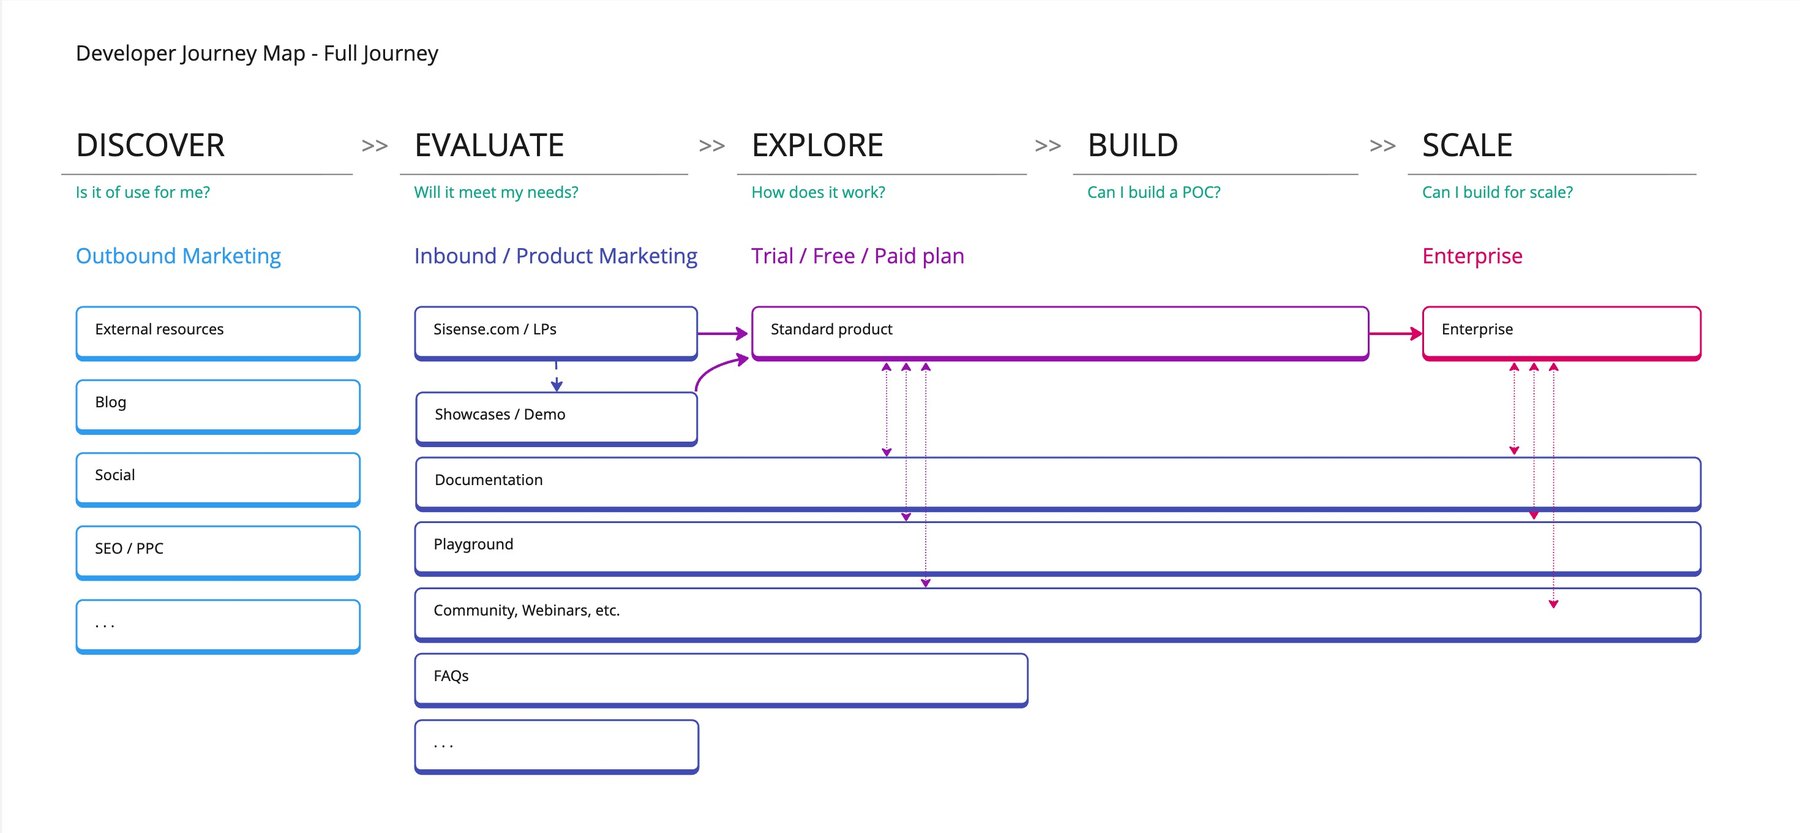
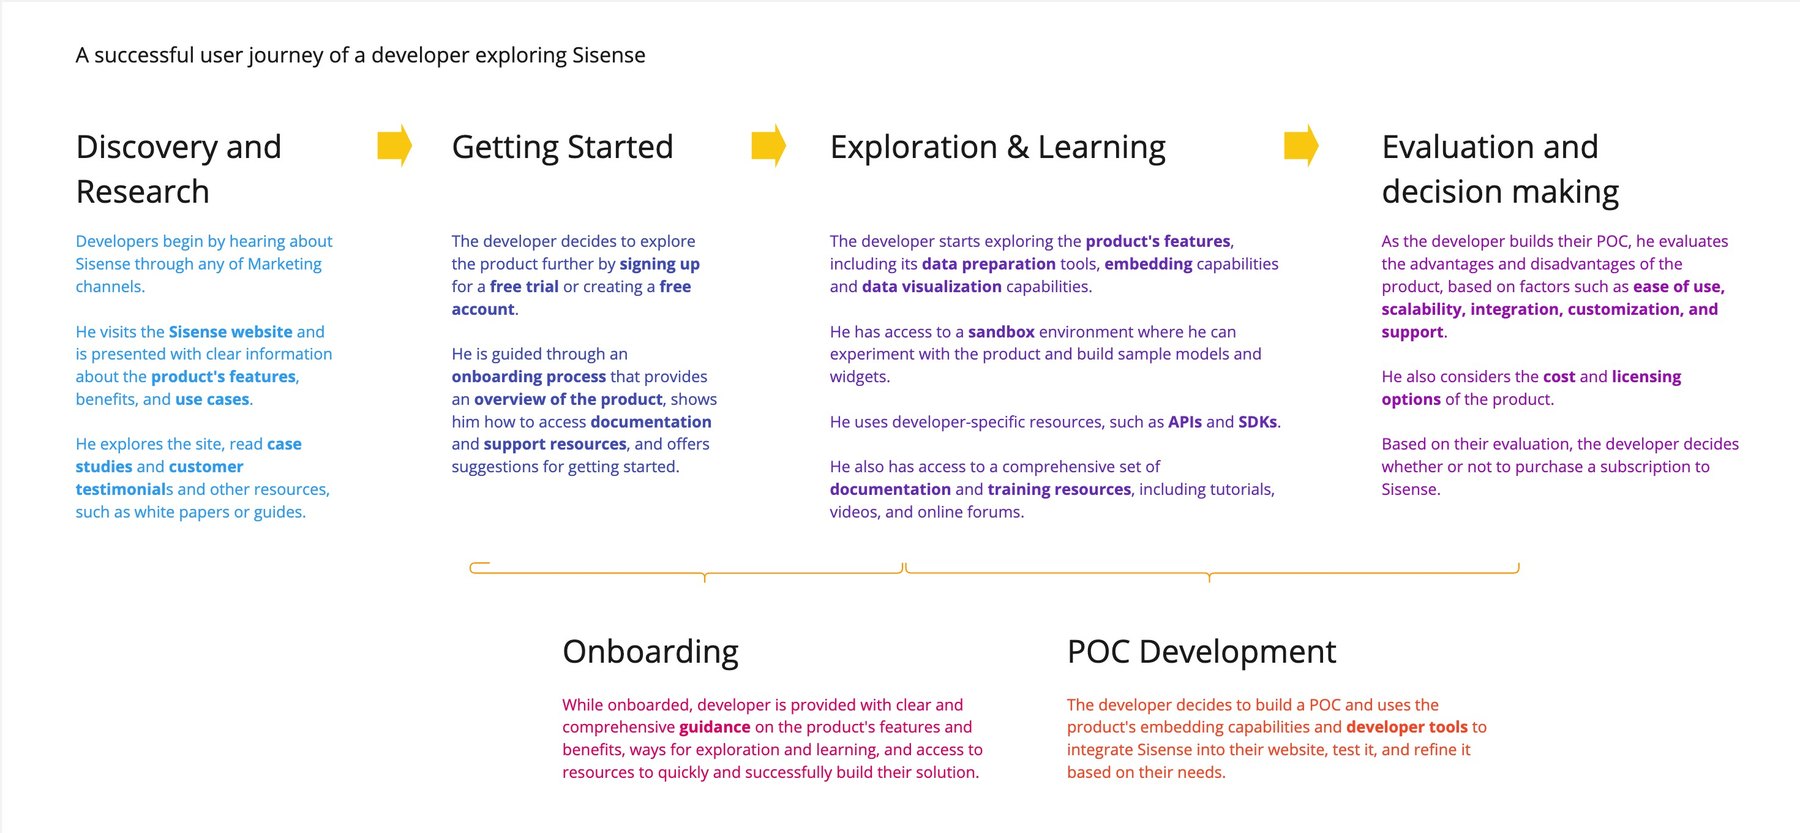
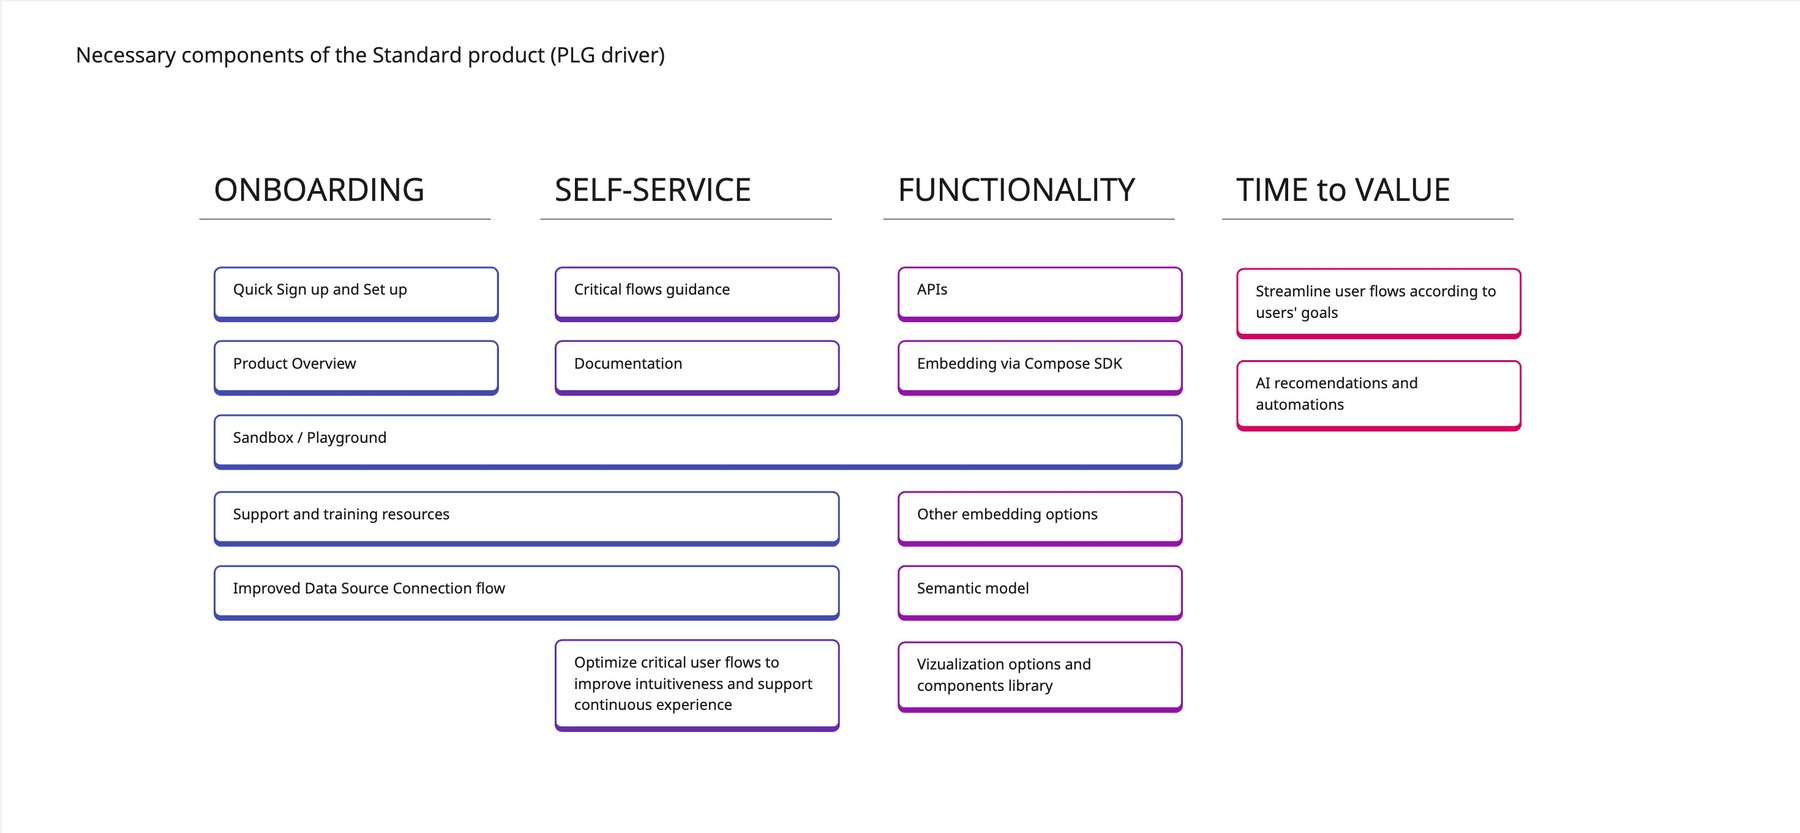
From that path we derived what the product had to ship with, grouped by the job each component does - onboarding, self-service, functionality, and time to value.
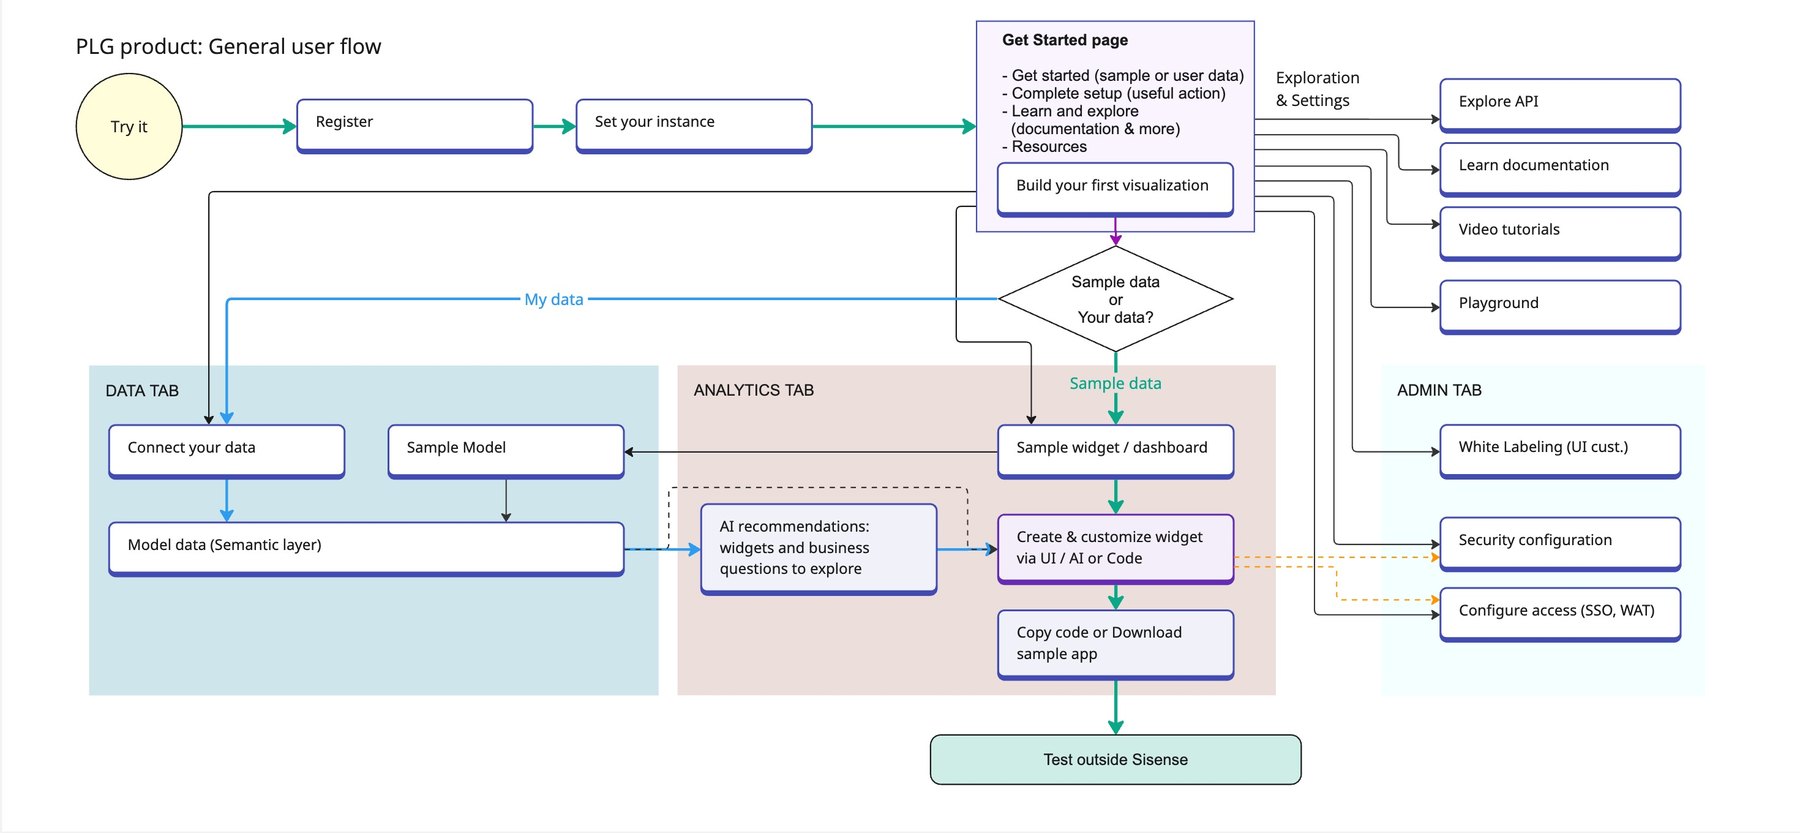
The strategy then resolved into a concrete product flow. Its defining decision: two entry paths stay open at all times - sample data and your own data - so a first result never depends on completing a connection.
2a
The design system
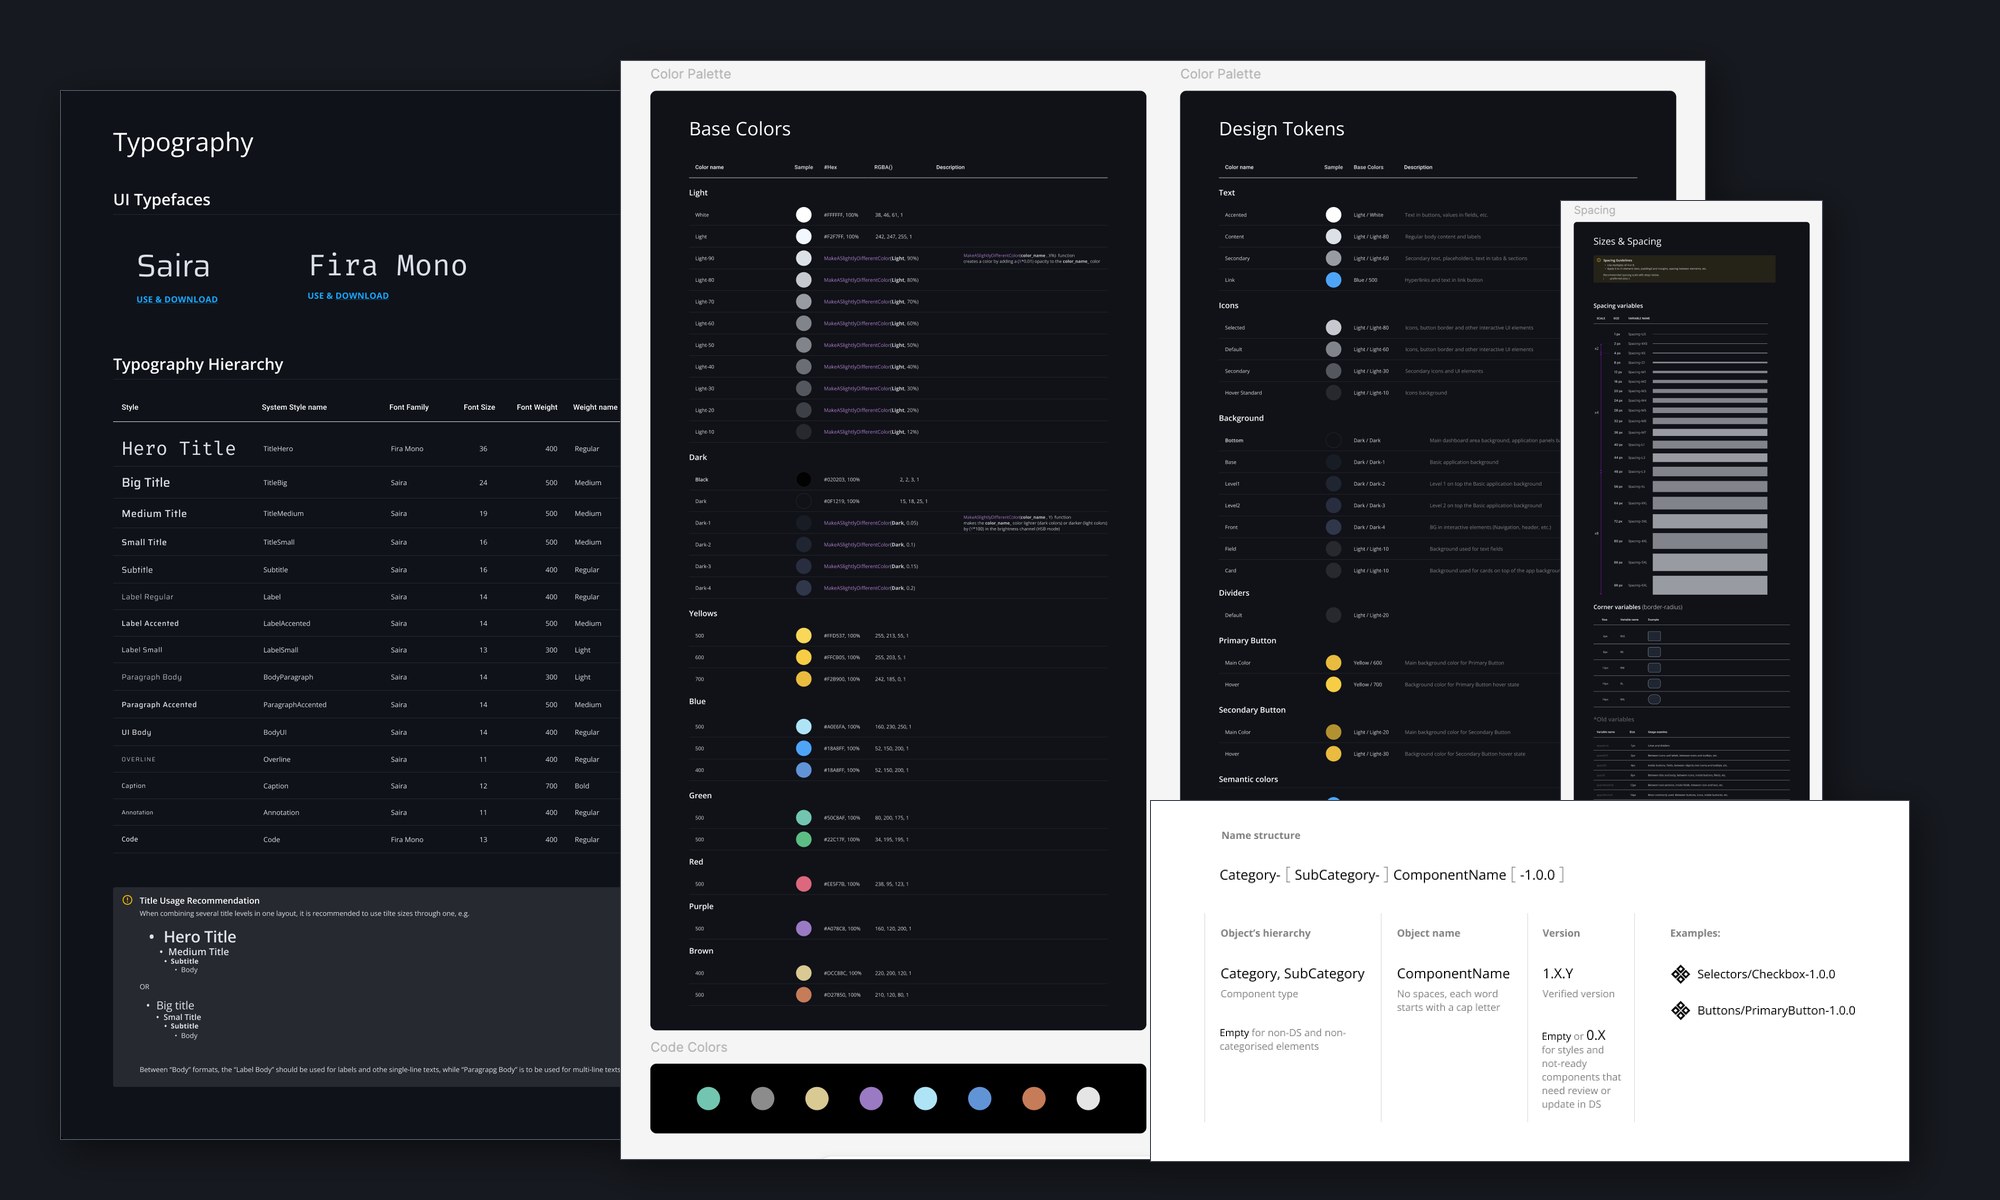
Built on the existing Sisense platform so components could be shared and both design and implementation could move faster - but with a new architecture underneath: design tokens and variables driving the theme. A step forward from what the platform had.
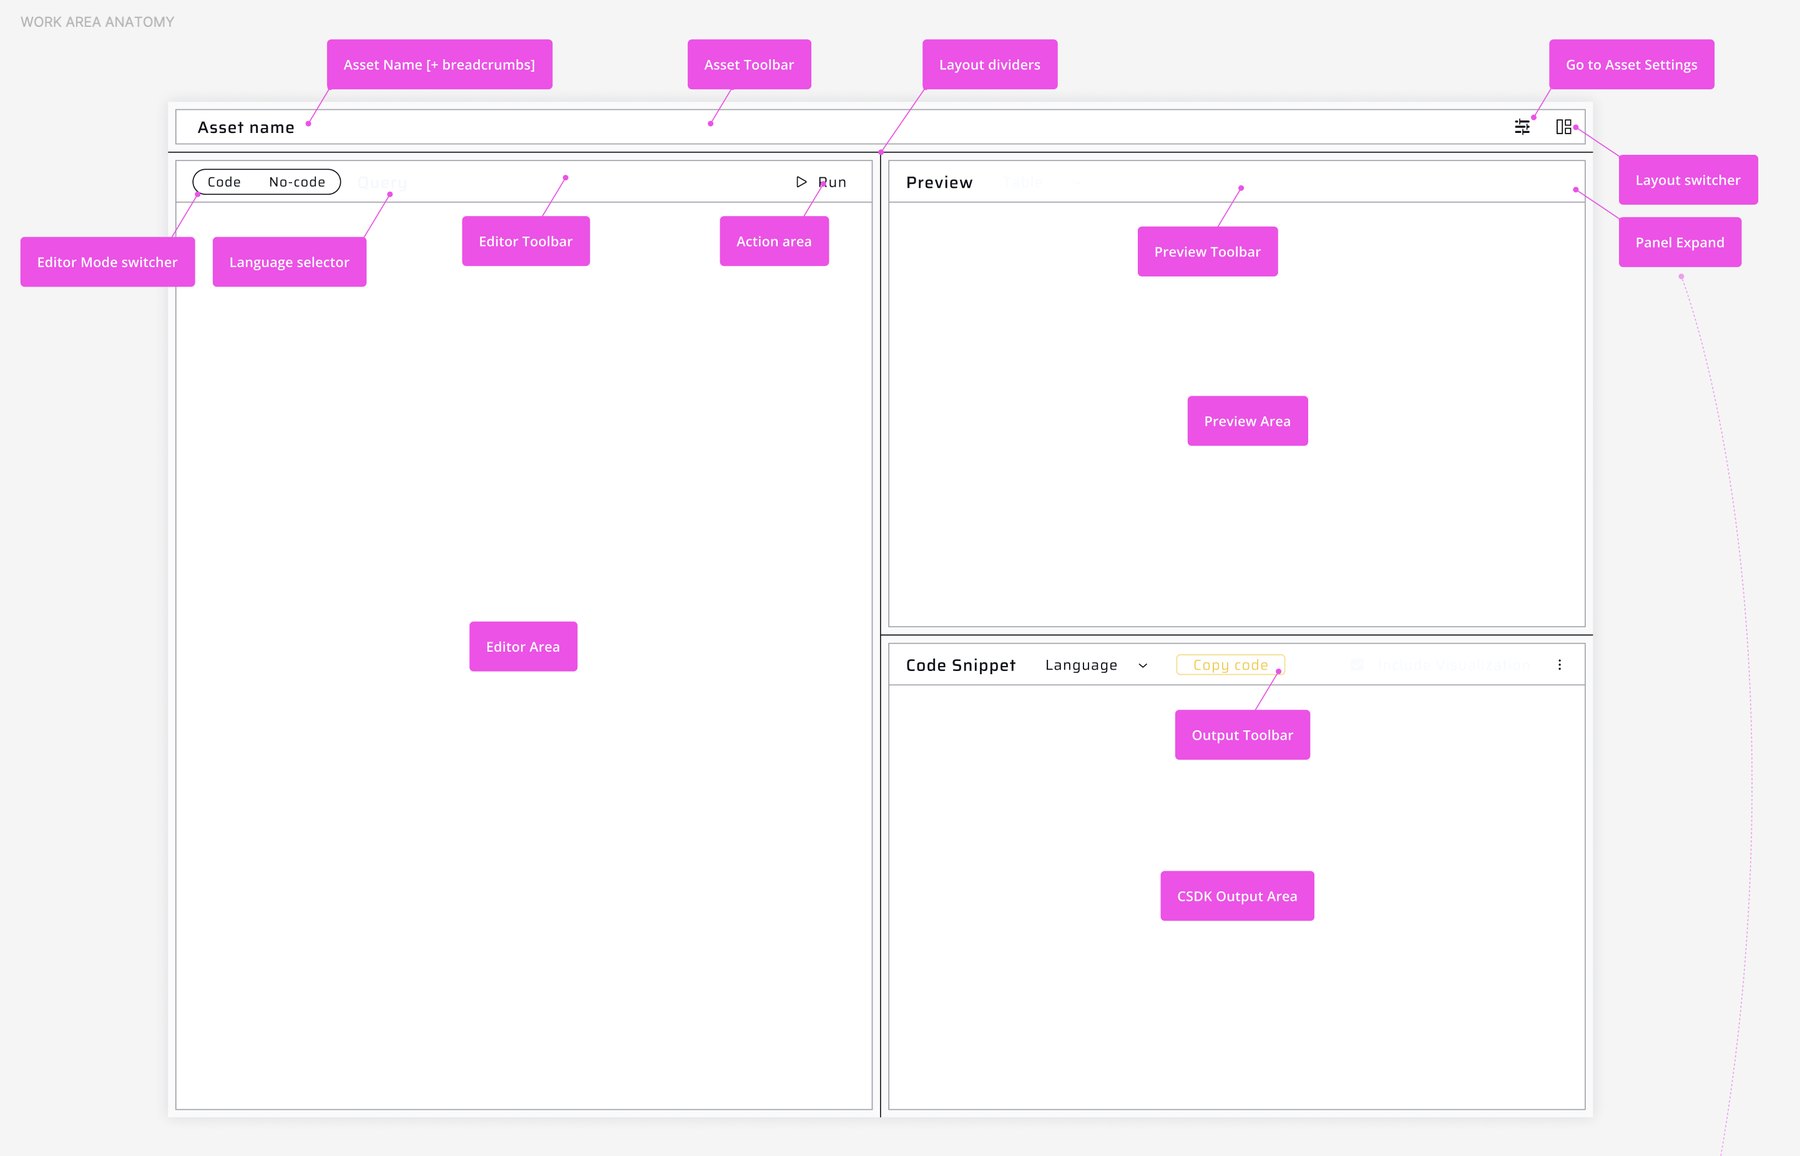
To let the main persona feel at home, the interface follows IDE conventions - editor-and-preview panes, code exposed wherever code exists. The dark theme was a product decision rather than a stylistic one, taken for the same reason.
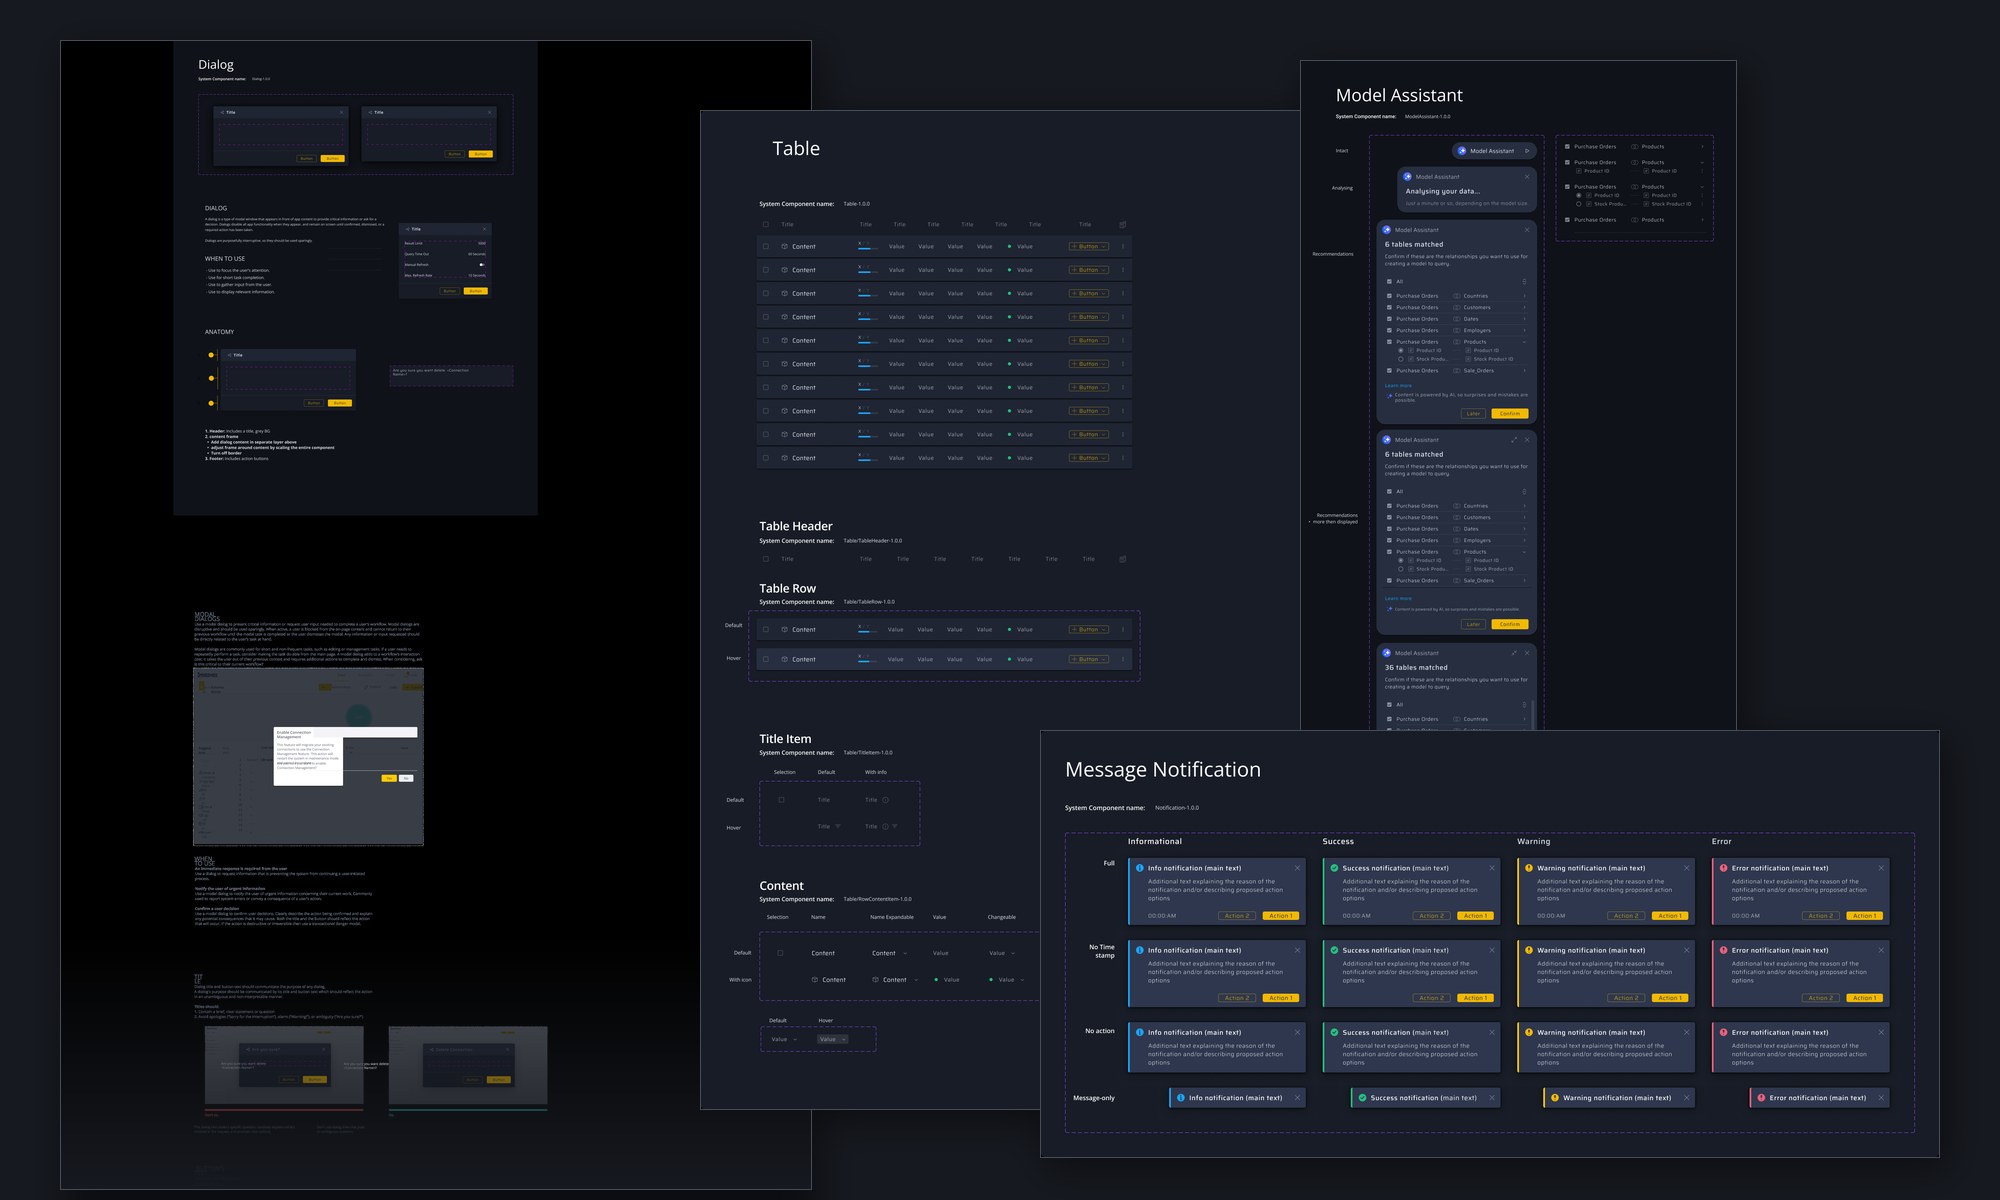
Work area layout. Every work area shares one anatomy, taken from IDE conventions and validated against real content: editor pane, live preview, generated output. The organizing principle is user control - panes resize, collapse, and switch, so one anatomy serves areas whose content differs.
2b
The happy path
In parallel we built one end-to-end path - connect, model, query, take the code - as the spine the individual areas hang from. It served to understand the flow as a whole, to validate it with design partners, and to demonstrate it to stakeholders; the validation that mattered came from the partners, not the room. The prototype appears at the end of this case, since it reached its final form only after every area below was designed.
3a
Connections
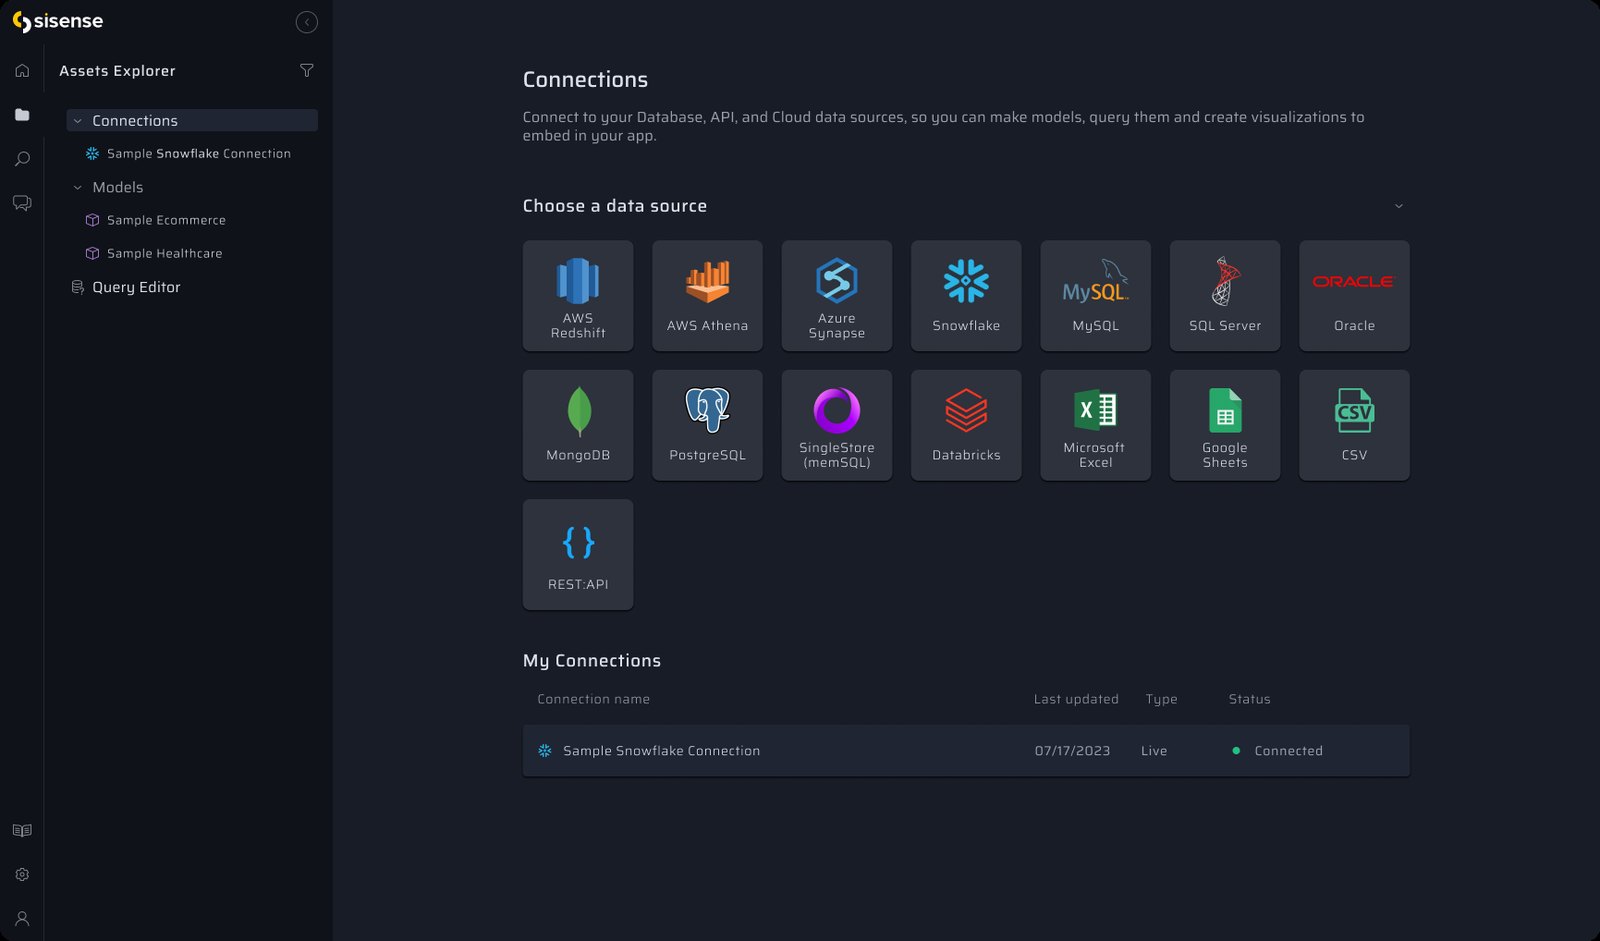
Getting data in is the first place a self-serve user can stall. The connection list carries state - what is connected, what depends on it - so the next step stays visible from wherever you are.
3b
Three views of one model
The starting hypothesis was that developers want to see the code behind anything they work with, and to edit it. A model is therefore a code artifact, with the diagram and the table as equal views of it - not simplified alternatives for people who cannot read code.
Testing qualified that hypothesis. Even among developers, participants reached for the visual view to understand a model’s structure: direct manipulation and spatial layout conveyed it faster than a definition file did. The same held for charts. Parity stopped being a concession and became the design position - not code-first with a visual fallback, but three views the user moves between depending on the task.
3c
Modeling with assistance
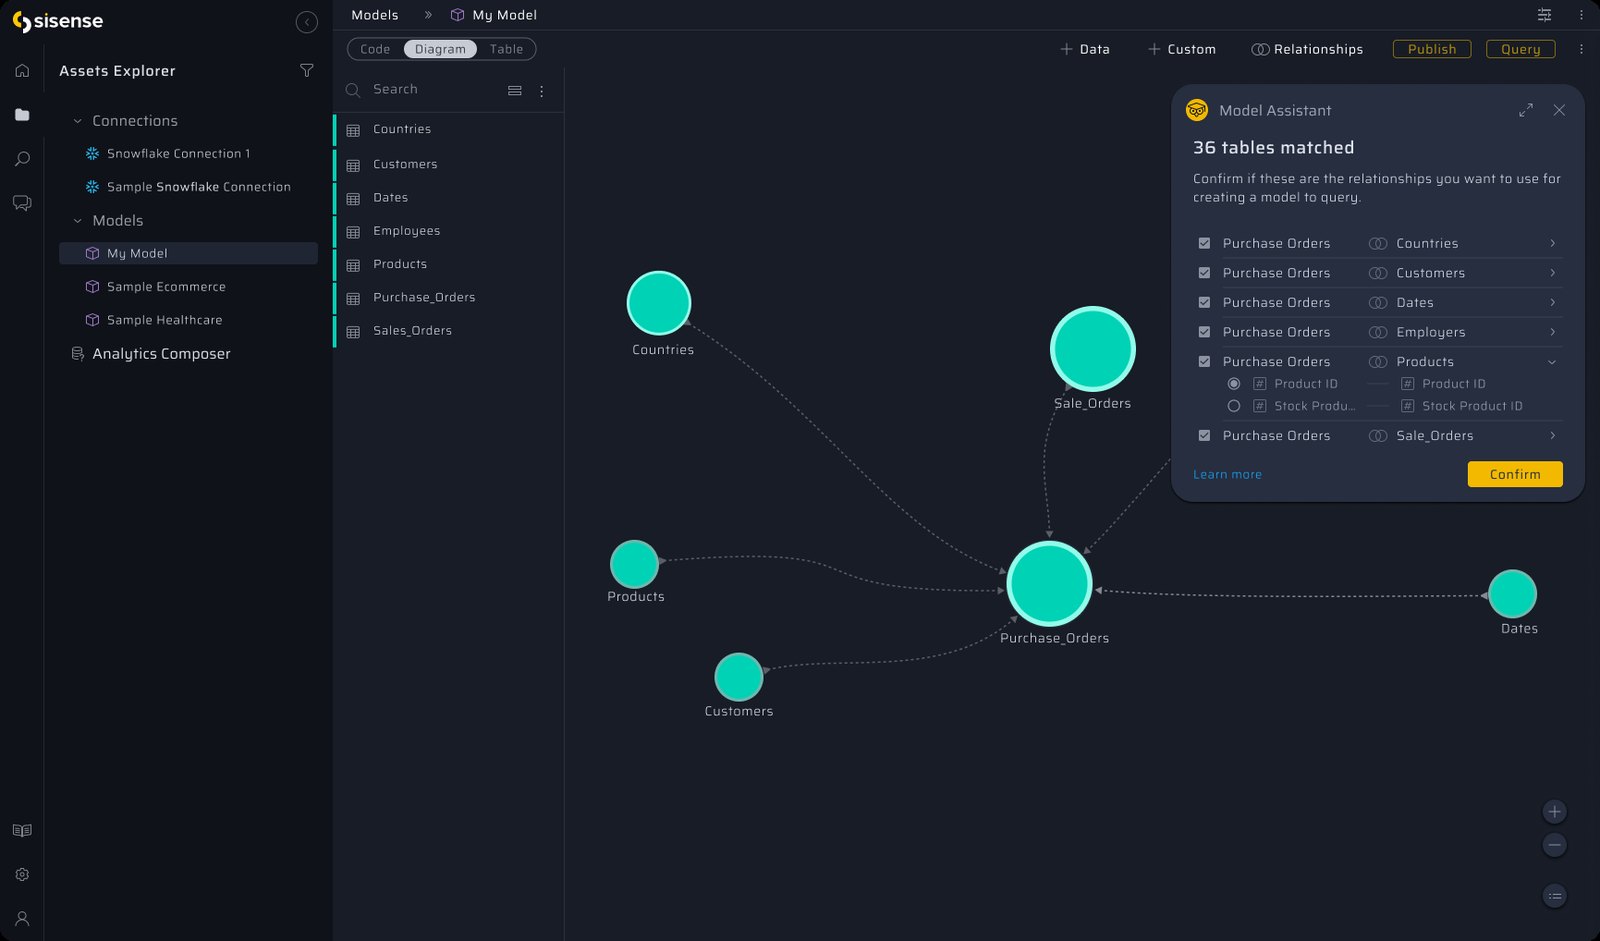
Modeling is the step a developer team cannot skip and often is not equipped for. I had argued for automated modeling as a core capability before Forge existed; here it had a specific job - removing the one prerequisite that would otherwise stop a self-serve user cold.
The assistant scans the tables and proposes the relationships between them. It does not apply them: each one is listed, expandable to the key level, and confirmed or rejected by the user. Two reasons for keeping that decision with the user:
- Reliability. Inference was not dependable enough on tangled data stacks to apply silently.
- Trust. A system that rewrites the structure of your data without showing its work does not earn trust - it spends it.
3d
Query and output
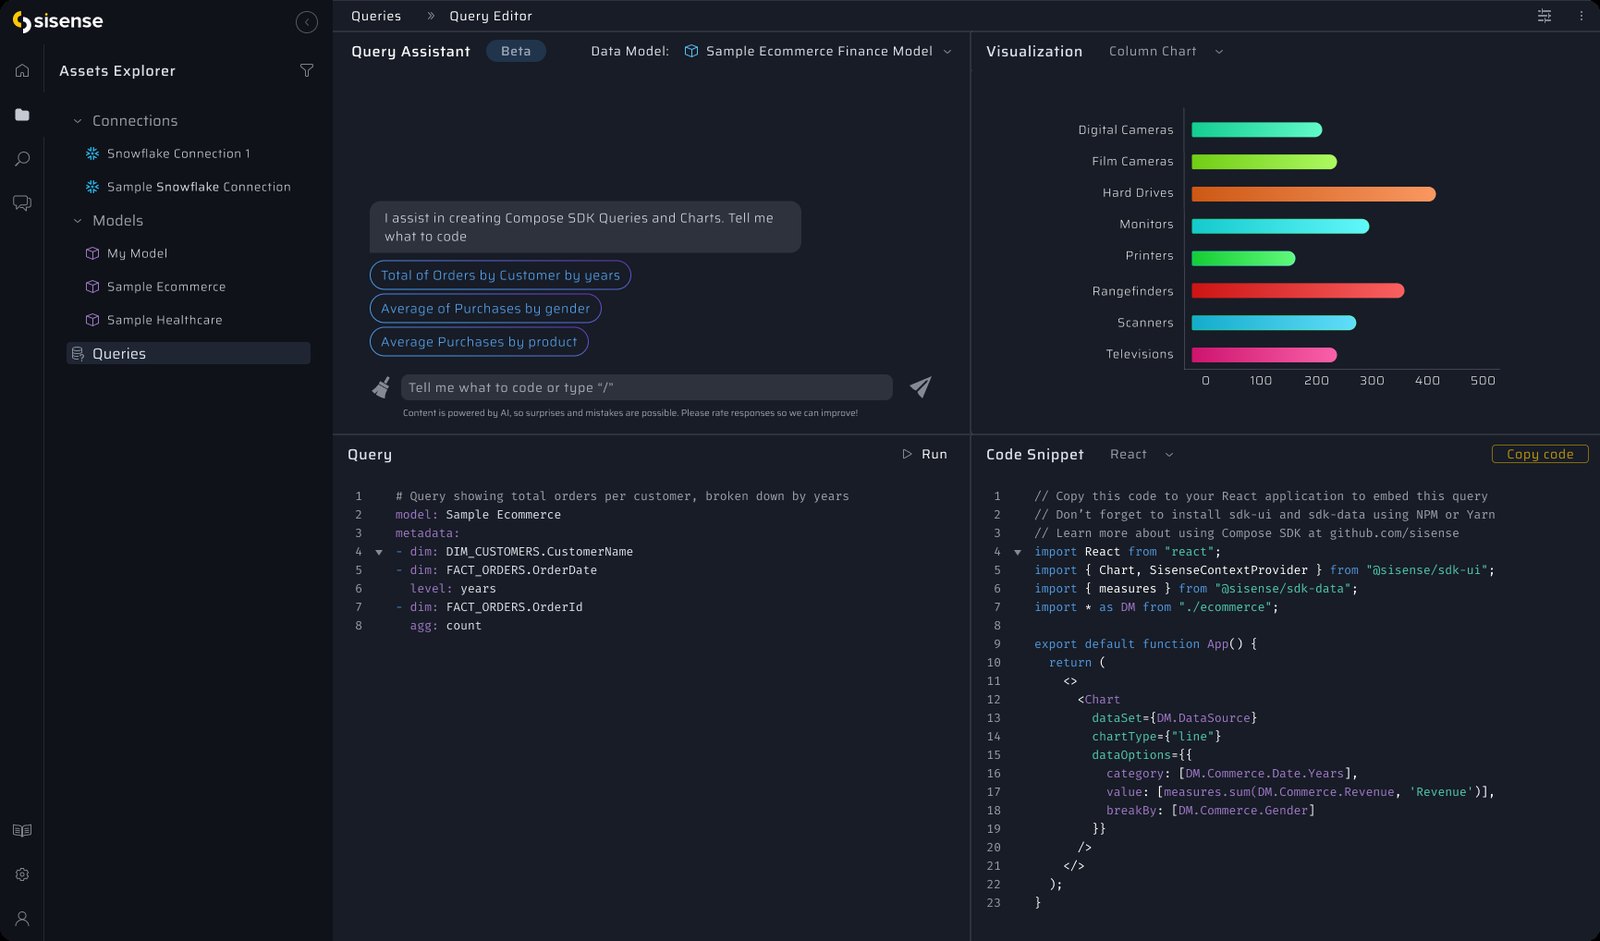
The output is the deliverable - a Compose SDK snippet ready to paste into a React application. A query assistant turns a plain-language question into a query, so a first result is reachable before anyone has learned the syntax.
3e
What we changed
Two areas took substantial iteration.
Connecting data to modeling. This seam had never worked well in the main Sisense platform. We designed several ways of joining the two flows, tested them, and selected the one participants completed most reliably - not the one that was structurally tidiest.
The query editor. Design partners initially reported that the information they needed was not where we had put it. Several rounds of deciding what belongs in the editor, in the preview, and in the output produced the final arrangement.
The prototype below is where those decisions landed - the happy path as it stood when the project closed.
Outcome
Forge never launched publicly, so there are no adoption numbers. What we have is the design partner assessment: measured against the existing product, Forge was faster to get value from and materially clearer to work through unassisted - which was the premise of the line.
For me this was the project that turned PLG from a tactic into a system: how self-serve adoption, developer expectations, and product architecture constrain one another, and how much of the growth motion is decided inside the first session with the product. It remains one of the projects I think about most - my practical introduction to PLG, and invaluable for the work I have done in that direction since.